Methodology
Explanation of Terms & Methodology
Definitions
- ◦ FMCG value change is the sum of value sales for all categories compared with YA.
- ◦ To calculate FMCG volume change, we calculate how much volume contributes to the value change for each category, sum up these contributions and relate to value YA (this results in an average category change in volume)
- ◦ To calculate FMCG price paid change, we calculate how much price contributes to the value change for each category, sum up these contributions and relate to value YA.
- ◦ The difference between the FMCG Price Paid Change and Inflation (food inflation for all European countries, total inflation for Russia) are then a result of up-trading (buying higher priced products) or down-trading (buying lower priced products).
- ◦ Note that the changes are multiplicative and don't add back exactly.
- ◦ FMCG value change is the sum of value sales for all categories compared with YA.
- ◦ Consumer Confidence Index (CCI): The Consumer Confidence Index (CCI) is based on households' plans for major purchases and their economic situation, both currently and their expectations for the immediate future. Opinions compared to a “normal” state are collected and the difference between positive and negative answers provides a qualitative index on economic conditions.
How to read this chart
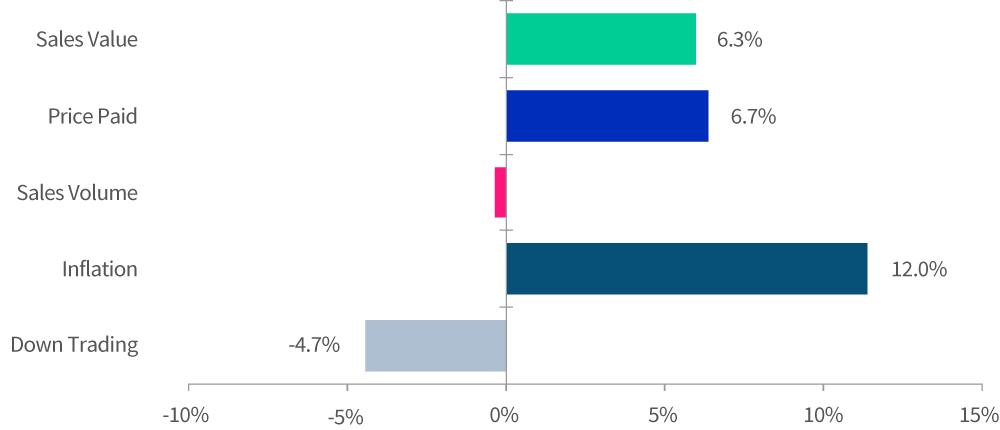
Sales value went up (6.3%), driven by changes in category price paid, (6.7%) whilst volume was down (0.4%).
We assume that Food inflation is a good proxy for actual price increases in FMCG.
The increase in prices paid (6.7%) is less than inflation (12%). This means that buyers choice has moved towards lower priced products by (-4.7%).
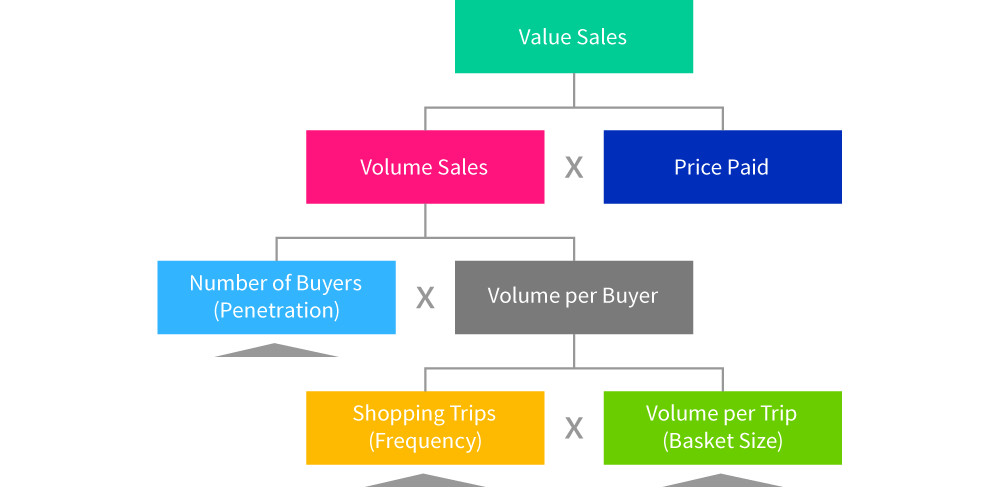
Measure Tree
- ◦ The ‘measure tree’ shows how value sales are a function of volume sales and price paid.
- ◦ Volume sales are dependent on three variables – the number of buyers, how often they buy and how much they buy on each occasion.
- ◦ For each category, we calculate the contribution made to volume changes by changes in the three other variables.
- ◦ Summing these category-specific contributions for all categories, we arrive at the ‘average category’ view (hence penetration can decrease as we are not looking at total FMCG, but at the average of all categories in the panel).